Optimize Your Test Case Chart. How To Write Tests For Clear Reporting?

This article was originally published on July 08, 2019, and has been updated for accuracy on February 18, 2024.
Almost half of the human brain is all about processing visuals. That’s why clear data visualization is crucial in businesses, especially when making smart data-driven decisions. In this article we will guide you through writing a test case chart, emphasizing the role of creating transparent and insightful testing reports that all stakeholders will understand.
Graphs and test case chart in testing. Why do you need data visualization?
In testing, just like in business, graphs, and charts are our go-to tools for simplifying complex data. Picture this: all your test results, performance metrics, and bug reports are organized in one visual hub. That’s the magic of testing dashboards.
These dashboards use test case charts to communicate test results. They highlight trends, reveal connections, and flag anomalies, making the testing process more transparent.
There are a wide range of graphs to choose from. From performance-tracking line graphs to test coverage bar graphs, matrixes, and pie charts. Each type serves a specific purpose. Choosing the right chart is like picking the perfect tool, ensuring your testing visuals display the exact information you need.
What is a test case in software development?
In software development, a test case is like a set of instructions to make sure that a piece of code works as intended. It’s a way for developers to test their software by providing specific inputs and checking if the outputs match what they expect.
What is a test case example?
Let’s consider a simple example of a login functionality for a website. In this case, a test case could be created to verify that the login process works correctly. Here’s an example test case:
Test Case: User Login
Preconditions:
The user has a valid account on the website.
The website is accessible and functional.
Test Steps:
a. Open the website’s login page.
b. Enter a valid username and a valid password.
c. Click the “Login” button.
Expected Result:
The user should be successfully logged into their account, and the website should redirect them to the homepage.
Postconditions:
The user is logged in, and their account information is displayed correctly on the homepage.
This test case checks the login functionality under specific conditions, such as using valid credentials. If the actual result matches the expected result, the test case passes. If there are any issues, the developers can identify and fix them before releasing the software to users.
How do you structure a test case?
In software development, well-structured test cases are essential. Here’s a concise guide:
- Test Case ID – assign a unique name or number for easy identification.
- Description – provide a summary for context.
- Preconditions – outline initial requirements.
- Test Steps – clearly articulate step-by-step actions.
- Test Data – specify required inputs.
- Expected Result – define anticipated outcomes
- Actual Result – write down the observed outcome.
- Postconditions – describe the expected post-test state
- Status – indicate current test case status.
- Notes – include additional comments or observations.
This structured approach enhances clarity, consistency, and effectiveness in testing, ensuring early identification and resolution of potential issues.
What is a typical test case template?
Here’s a basic template that you can use or customize based on your project and team preferences:
Test Case ID: TC001
Title/Summary: Verify successful login with valid credentials
Description: This test case checks whether the login functionality works as intended when valid credentials are provided.
Preconditions:
– The user has a valid account on the website.
– The website is accessible and functional.
Test Steps:
1. Open the website’s login page.
2. Enter a valid username and a valid password.
3. Click the “Login” button.
Test Data:
– Username: testuser
– Password: testpassword
Expected Result:
– The user should be successfully logged into their account, and the website should redirect them to the homepage.
Actual Result:
– [Space for the tester to fill in]
Postconditions:
– The user is logged in, and their account information is displayed correctly on the homepage.
Status: [Not yet executed / In progress / Passed / Failed]
Notes/Comments: [Any additional comments or observations]
What is a test case sheet?
A test case sheet, also known as a test case document or template, is essentially the same thing. It’s a structured document used to record and organize information about individual test cases during software testing. It typically includes details such as the test case ID, description, preconditions, test steps, expected results, actual results, and postconditions.
How do you write a perfect test case?
Now, we’ll walk you through creating perfect test cases. Starting with the right approach influences future chart and report creation, making your testing consistent.
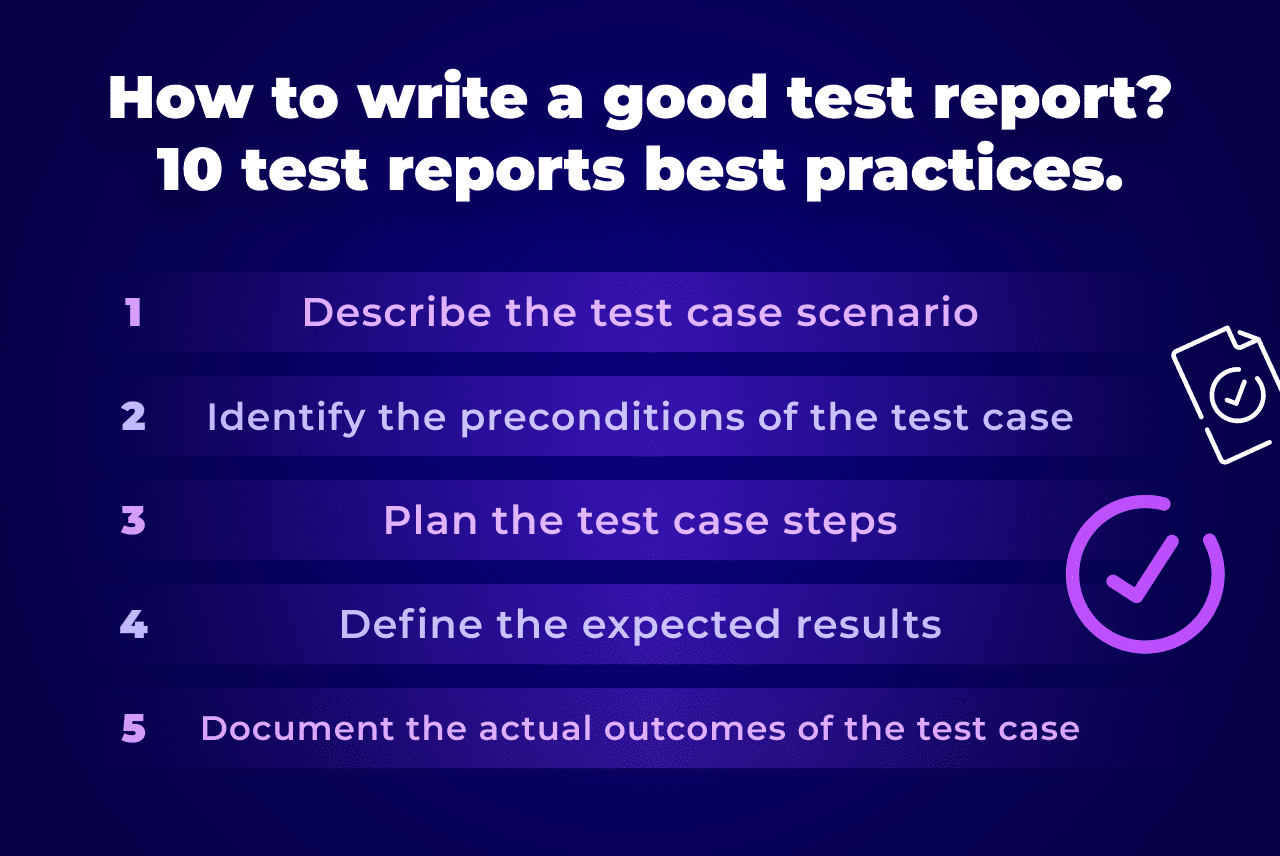
1. Describe the test case scenario
To describe a test case scenario, you outline the specific conditions, inputs, and actions needed to validate a particular aspect of the software. This description should provide enough information for someone to understand and execute the test successfully.
2. Identify the preconditions of the test case
To identify the preconditions of a test case, figure out what needs to be set up before you can start testing. This includes any necessary conditions, settings, or information that must be ready for the test to work correctly. Having these things in place ensures that your testing is accurate and goes smoothly.
3. Plan the test case steps
Planning the test case steps effectively involves describing the specific actions you’ll take during the test in an organized way. Break down what you want to test into simple steps. Each step should be like a small instruction, showing exactly what needs to be done. This helps make sure you cover everything and makes the testing process easy to follow for anyone.
4. Define the expected results
Defining the expected results is like predicting what should happen after you follow each step in your test. Be specific about what you anticipate – what you should see or experience when the test is successful. This helps you know if everything is working as it should.
5. Document the actual outcomes of the test case
After following the steps, carefully note what you see or experience. If things go as expected, great! If there are any surprises or differences, it’s important to record those too. This information helps everyone understand how the test went and whether any adjustments are needed. Think of it as creating a report card for your test – what occurred versus what you thought would happen.
Types of test cases
Different test case types, focusing on aspects like functionality, performance, and security, influence the test case reports and charts. By incorporating diverse test case types, these charts provide a comprehensive overview of software quality.
Functionality Test Case
Description: Checks if each job a program should do gets done right.
Example: Making sure a calculator app can add, subtract, multiply, and divide numbers correctly.
User Interface Test Case
Description: Analyses how the elements in the software look and work.
Example: Checking if buttons in a phone app are easy to find and use.
Performance Test Case
Description: Verifies how fast and well the program works, especially when a lot of people use it.
Example: Testing how quickly a website loads when many people are trying to use it at the same time.
Integration Test Case
Description: Make sure different parts of the program share information correctly.
Example: Testing if the part of a shopping app that deals with payments and the part that tracks inventory work together without any problems.
Usability Test Case
Description: Checks if the program is easy for people to understand and use.
Example: Seeing if a new map feature in a museum guide app is easy for users to navigate.
Database Test Case
Description: Ensures that the program’s database is working right.
Example: Checking if a customer database keeps information correctly and can get it back when needed.
Security Test Case
Description: Looks for ways people could try to mess with the program or gather sensitive information.
Example: Checking if a program keeps passwords safe and data secure.
User Acceptance Test Case
Description: Checks if the program is what people want and works the way they expected.
Example: Making sure users like and find useful new things in a software update.

Sample test cases for test case chart and graphs
Software testing involves looking closely at test reports like charts and graphs. To make sure these visuals show the right information, it’s essential to design detailed test cases. In this section, we’ll explore sample test cases made especially to see how they will work on charts.
How do I create a test case in Excel?
Creating a test case in Excel involves organizing information in a structured manner. Here’s a simple guide to how to do it easily:
- Launch Microsoft Excel and open a new or existing spreadsheet.
- Use the first row to create headers for different sections
- Enter Test Case Information
- Format and Organize
- Repeat for Multiple Test Cases
- Save the Document
Below, you can see the example of a test case in an Excel table:
Free test case template
| Test Case ID | Title | Description | Preconditions | Test Steps | Expected Results | Actual Results | Postconditions |
| TC-1 | Login with valid credentials | Verify that users can log in to the application using valid credentials. | A valid username and password are available. | 1. Open the application. 2. Click on the login button. 3. Enter the valid username and password. 4. Click on the login button. | The user should be successfully logged into the application. | The user was successfully logged into the application. | The user is logged in and can access the application’s features. |
How do you write a test case for a bar chart?
To write test cases that will contribute effectively to a test case report on a bar chart, consider following these good practices:
- Clear Test Case IDs and Descriptions – use concise Test Case IDs and descriptions that clearly describe the purpose of each test.
- Structured Test Steps – organize test steps in a structured and sequential manner. Break down the verification process into clear and easy-to-follow steps.
- Detailed Expected Results – provide detailed and specific expected results for each test case. Clearly articulate what the user should see or experience if the test is successful.
- Actual Result Documentation – ensure there is a designated space to record actual results during test execution. This information will be crucial for the test report.
- Relevant Preconditions and Postconditions – clearly define any preconditions necessary for the test, and outline postconditions that describe the expected state after the test has been executed.
- Visual Verification – where applicable, incorporate steps for visually verifying the appearance of the bar chart. This could involve checking colors, styling, and overall aesthetics.
- Performance Testing – if performance is a consideration, include test cases that assess how the bar chart handles different data volumes and scenarios.
- Accessibility and Compatibility Checks – Verify the accessibility and compatibility of the bar chart in different environments, browsers, and devices.
- Error Handling Scenarios – Include test cases that explore how the bar chart responds to errors or unexpected conditions. This could involve testing with missing data or incorrect input.
- Use Meaningful Titles and Headers – in the test case document, use meaningful titles and headers to distinguish different sections and make the document easy to navigate.
By incorporating these elements into your test cases, you’ll be better positioned to generate a comprehensive and visually appealing test case report specifically tailored for bar chart testing.
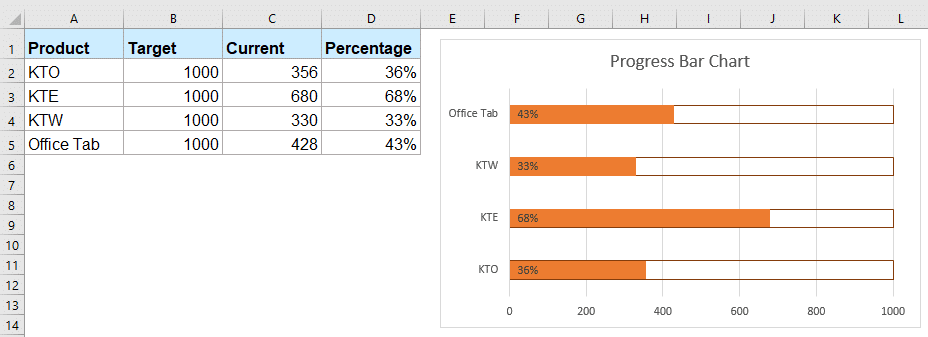
How do I make a bar chart?
You can create a bar chart using various software tools. At the beginning of your testing journey, you can use Microsoft Excel or Google Sheets. To insert a chart, look for an option to create it inside the tool. This is often found in the “Insert” or “Chart” menu. Next, select “Bar chart” or a relevant subtype based on your preference. After that, customize the chart by adjusting elements like colors, titles, labels, and formatting to improve its visual appeal and clarity.
Here’s an example of a simple progress bar chart made in Excel:
How do you structure a bar chart?
Below you’ll find a summarized guide to structuring a bar chart:
- First, choose and organize the data you want to represent.
- Define the x-axis for categories and the y-axis for values.
- Clearly label both axes with descriptive and understandable labels.
- Create bars for each category, with the length or height corresponding to values.
- Decide on gaps between bars for visual clarity.
- Use meaningful colors to distinguish bars.
- Include a legend if using multiple colors for different purposes.
- Provide a clear title summarizing the chart’s purpose.
- Add gridlines for axis reference if needed.
- Include text or annotations to highlight specific points
- Choose appropriate scaling for accurate representation.
- Note the data source if necessary.
What is a test case diagram?
A test case diagram typically refers to a graphical representation that displays the relations between different test cases and other testing objects. However, the term “test case diagram” isn’t a standardized or widely recognized concept in the field of software testing or testing methodologies.
If someone refers to a test case diagram, they may be describing a visual representation of test cases, possibly illustrating the flow of execution. Alternatively, it could be a diagram used for test planning, showing how different test cases contribute to testing different aspects of the system.
Tools for test case charts
Some tools can help you build perfect test reports for your test cases. These tools not only help you write perfect test cases right from the start. They also simplify the process of documenting test results, making it easier to generate well-structured reports.
Test case management in Atlassian’s Jira
Test case management is crucial in software development. Jira, a popular project management platform, offers powerful features for managing test cases. Keep in mind that the native Atlassian product might be limited. Especially when it comes to more demanding teams. The situation changes when it’s extended with apps.
How does Requirements and Test Management for Jira help with presenting test case execution in Jira?
Many teams still store their test cases, test steps, and reports in external Excel sheets, which often causes problems with scattered elements. When you have all your testing objects organized with a dedicated app, reporting from the particular stages is intuitive. Your team can generate reports directly from the tool.
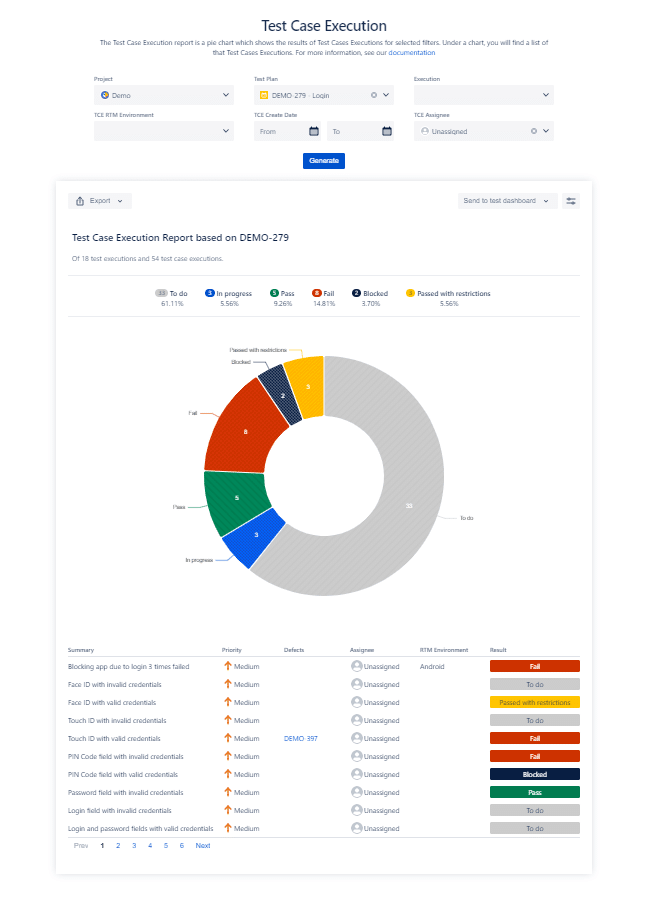
Test Case Execution report in RTM for Jira
The generated report has the form of a described pie chart. Above the graph, we can see the number and the percentage of passed or failed test cases. We can also track their current status. It shows what part of all tests is passed with restrictions, in progress, blocked by others or yet to be done. Below, there is a table with a summary and details of each test case, such as its priority or related defects. The dashboard can be exported to a .pdf or .csv file ready to present to the stakeholders during a meeting.
How to make the most of the test case chart?
The RTM’s Test Case Executions report is fully flexible. It prevents getting lost in a multitude of test cases and their statuses. By clicking on the Preferences icon in the upper right corner of a table, we can select which type of test case execution status we need the dashboard to show. A good practice is to use it to view only the failed test cases to fix them in the first place.
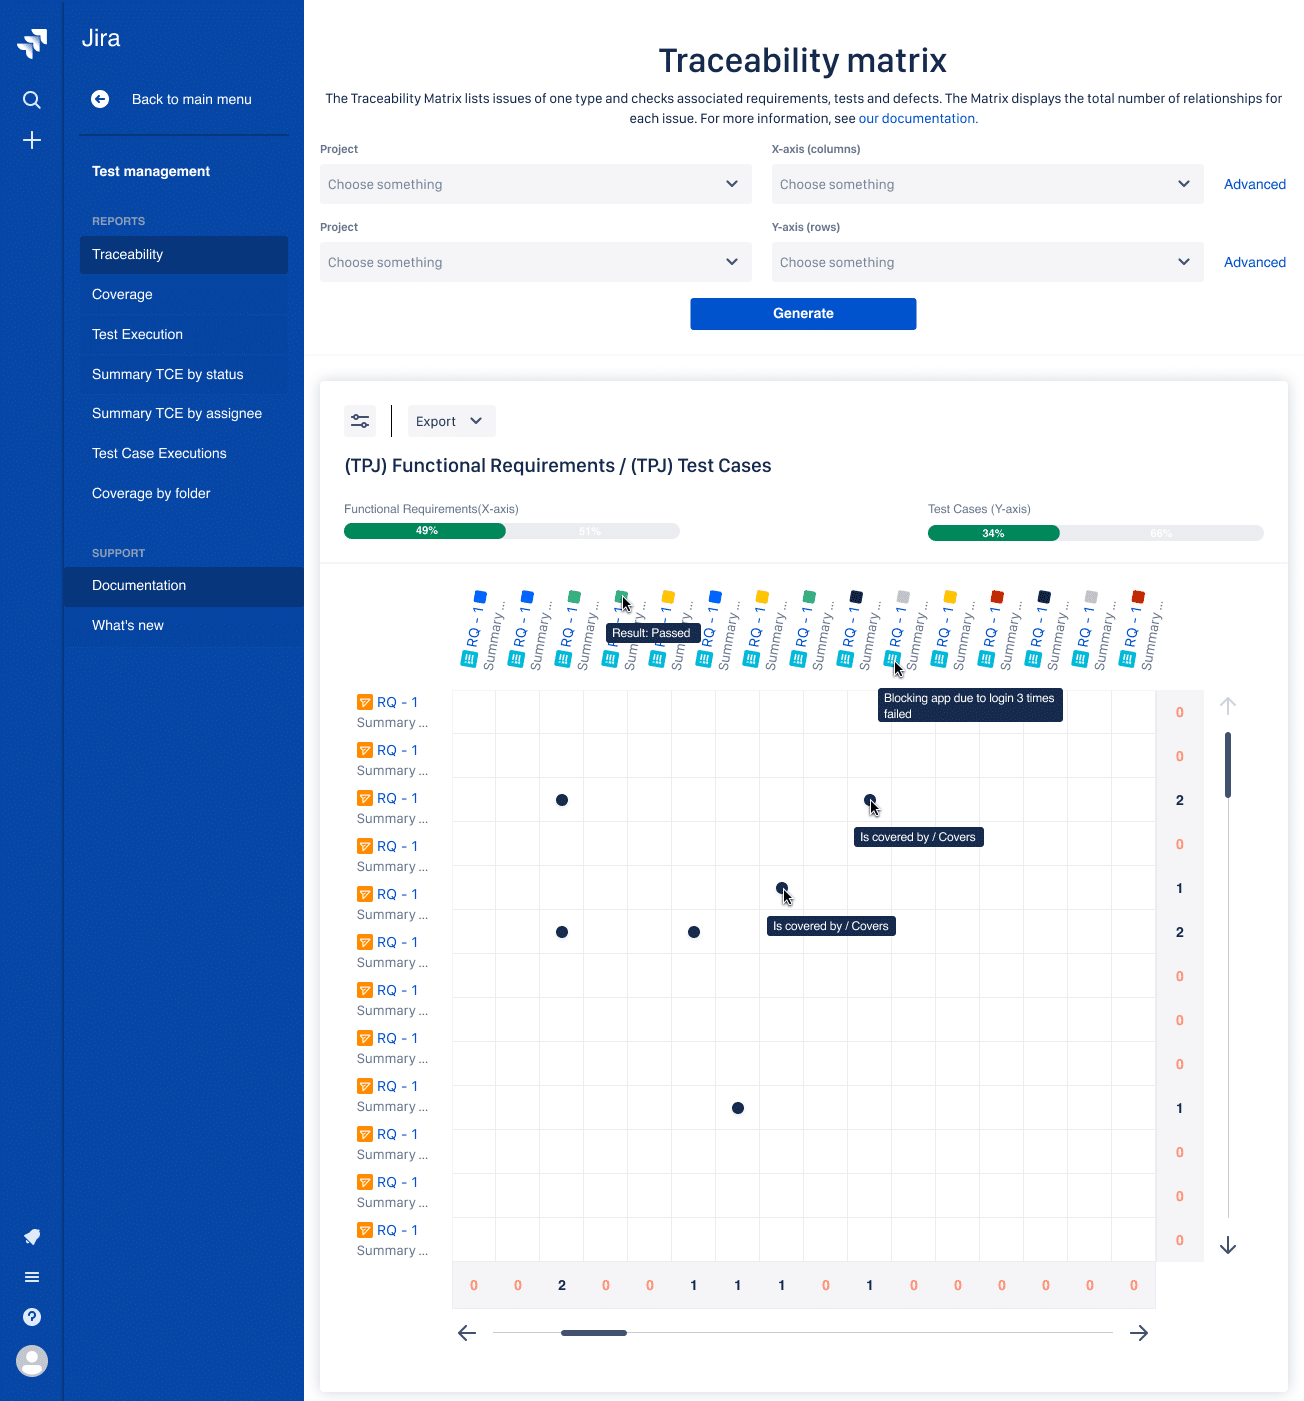
How do you create a test case matrix?
Requirements and Test Management for Jira requires another report that shows the coverage of your test cases. It’s called the Traceability Matrix.
The Traceability Matrix shows different connections between the two baseline issue types. You can adjust the data on the X and Y axes using JQL. This way, it’s possible to apply more advanced filters if needed. With JQL custom functions, you can see connections from various testing and development projects. The Traceability report in RTM lets you check the overall number and types of relationships for each issue.
Frequently Asked Questions about Test Case Chart
-
Can you provide examples of good and bad test cases?
Good test cases are specific and cover a range of scenarios, while bad test cases are vague, assumption-based, and lack clear expectations.
For example:
Good: “Verify that the ‘Login’ button is displayed prominently on the home page.”
Bad: “Check the home page.”Good: “After clicking the ‘Submit’ button, the user should be redirected to the ‘Thank You’ page.”
Bad: “Submit the form.”Good: “Test the system with different sets of valid and invalid data.”
Bad: “Use the same data for all test cases. -
How do you organize test cases?
Organizing test cases is essential for effective testing when faced with resource and time constraints. Here are some examples of strategies:
- Risk-Based Prioritization– prioritize based on the perceived risk of failure, focusing on high-impact areas.
- Functional Priority – rank test cases based on the importance of different functionalities, putting the critical features first.
- Requirement-Based Prioritization – align with high-priority requirements, concentrating on essential features and user stories.
- Business Value Prioritization – prioritize based on the contribution to business objectives, emphasizing features crucial to stakeholders.
- Regression Testing – prioritize test cases covering areas prone to regression and impacted by recent changes.
- Exploratory Testing Insights – use insights from exploratory testing to identify critical areas.
The chosen prioritization strategy may vary based on project goals and stakeholder priorities. Combining multiple strategies can lead to a comprehensive approach to test case prioritization.
-
What tools can be used for test case management?
There are various tools available to support test case management. One of them is Requirements and Test Management for Jira (RTM). It’s the best choice for teams that already use Jira for their project management.
Additionally, TestRail is a popular web-based test case management tool that facilitates the organization of test cases, test run planning, and result tracking. It integrates with several issue-tracking and test automation tools.
If you’re using Jira, explore tools like Zephyr and Xray for Jira, both of which integrate seamlessly with Jira and offer robust test case management features. These tools enhance collaboration and provide a centralized platform for managing and executing test cases.
While choosing your next test case management tool, consider your team’s specific needs, the ease of integration with existing tools, and the overall user experience.
-
Are there any industry standards for writing test cases?
Yes, there are industry standards for writing test cases. The most commonly followed include:
IEEE 829 Standard
The IEEE 829 standard outlines the format and content of various testing documents, including test cases. It provides guidelines for documenting test plans, test cases, and other testing-related documentation.
ISTQB (International Software Testing Qualifications Board)
ISTQB provides a set of principles and guidelines for software testing, including the creation of test cases. It emphasizes the importance of clear and concise documentation, traceability, and maintaining a structured approach to testing.
Arrange-Act-Assert (AAA) Pattern
This pattern is commonly used in unit testing, emphasizing three main steps: Arrange (setting up the test environment), Act (performing the test action), and Assert (verifying the expected outcome). While more specific to unit testing, the AAA pattern can influence the structure of test cases at various testing levels.
Given-When-Then (GWT) Format:
Often used in behavior-driven development (BDD), the GWT format structures test cases into Given (preconditions), When (actions taken), and Then (expected outcomes). It promotes clarity and readability in test cases.
Positive and Negative Testing:
Test cases should cover both positive scenarios (valid inputs leading to expected outcomes) and negative scenarios (invalid inputs, error handling, etc.).
Traceability
Test cases should be traceable to requirements, ensuring that each requirement is covered by one or more test cases. This helps maintain comprehensive test coverage.
Test Data Management
Clearly define the test data required for each test case. Include both valid and invalid data to ensure thorough testing.
Consistency and Standardization
Maintain consistency in language, format, and structure across all test cases. This makes it easier for testers to understand and execute them.
While these are general guidelines, it’s essential for teams to adapt their approach based on the specific needs of their projects and the methodologies they follow (e.g., Agile, Waterfall, DevOps). Regular reviews, collaboration, and continuous improvement are key to refining and optimizing test case writing practices within an organization.
Key takeaway
In conclusion, effective test case writing is crucial for transparent testing reports, helping stakeholders in making informed decisions. Furthermore, data visualization through graphs and test case charts simplifies complex testing data. After understanding and application of structured test case templates, such as the provided examples, testers can create detailed and clear documentation. Additionally, embracing industry standards like IEEE 829 and ISTQB, along with best practices ensures a consistent testing framework.